
Mastering Rapid Experimentation: A Comprehensive Guide to Testing Business Ideas
Quick Orientation
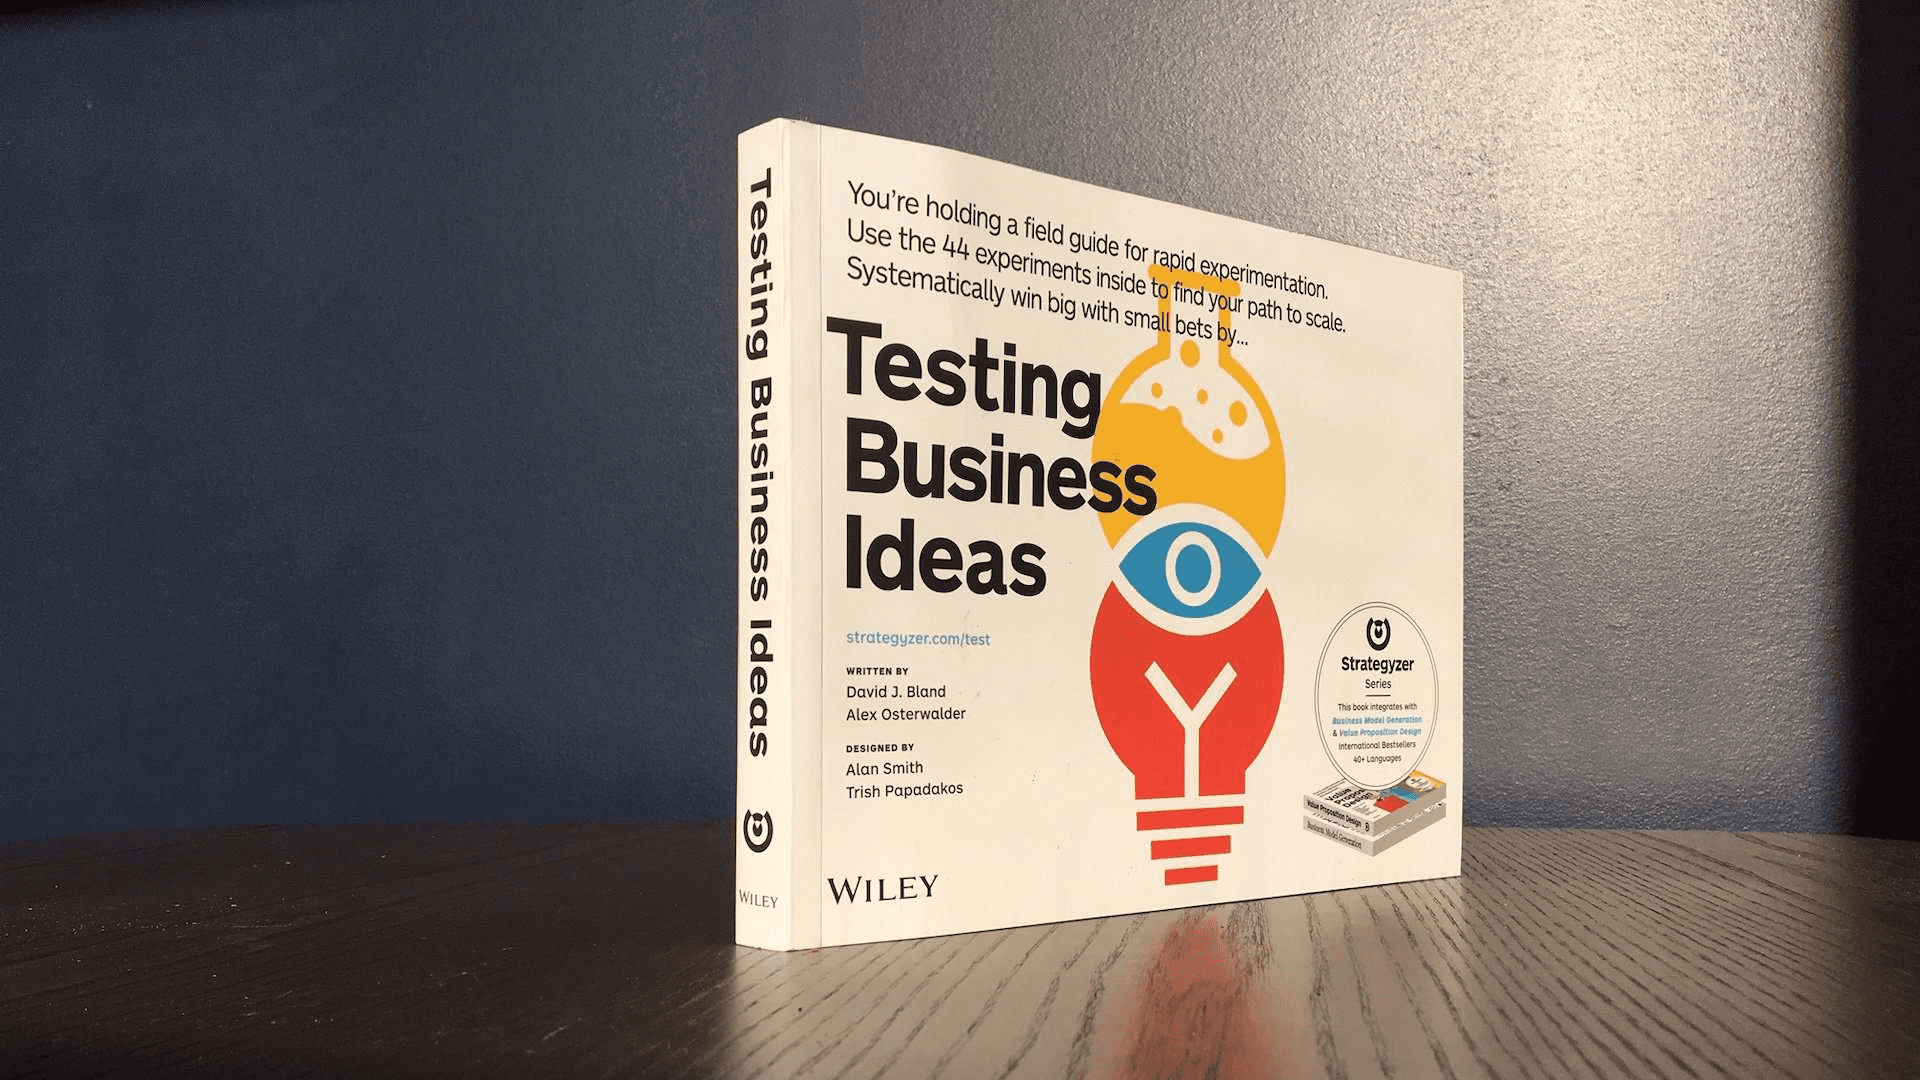
“Testing Business Ideas” by David J. Bland and Alex Osterwalder is a dynamic field guide designed to equip entrepreneurs, innovators, and solopreneurs with the tools and mindset for rapid experimentation. Integrating seamlessly with international bestsellers like “Business Model Generation” and “Value Proposition Design,” this book empowers readers to systematically win big with small bets. It’s a vital resource for anyone looking to reduce the risk and uncertainty associated with new ideas, offering 44 practical experiments to validate business models before premature execution. Throughout this summary, we will break down every important idea, example, and insight from the book in clear, accessible language, ensuring you grasp its comprehensive approach to de-risking new ventures and finding a path to scale. No significant detail will be left out.
Testing Business Ideas: The Foundation for Scale
This introductory section sets the stage by emphasizing the critical importance of testing business ideas before investing significant time, energy, and money. It highlights the common pitfall of prematurely executing ideas that look great on paper but fail in reality. The book’s core message is that testing is the primary activity for reducing risk and uncertainty in any new venture. It introduces the concept of a “field guide for rapid experimentation” designed to help you systematically win big with small bets.
The book is presented as part of a larger series that integrates with “Business Model Generation” and “Value Proposition Design,” international bestsellers. This connection underscores that “Testing Business Ideas” provides the practical “how-to” for validating the concepts developed using those foundational strategy tools. The ultimate goal is to find your path to scale by making your ideas “bulletproof with evidence,” preventing the waste of valuable resources on concepts that won’t work. The book positions itself as essential for anyone, from those new to testing to experienced practitioners looking to boost their skills or scale testing activities within an organization.
Starting Your Journey: Who Is This Book For?
This section clarifies the book’s target audience and the specific needs it addresses. “Testing Business Ideas” is crafted for three main types of individuals: Corporate Innovators, Startup Entrepreneurs, and Solopreneurs. Each group faces unique challenges but shares the common goal of de-risking new business ideas.
For Corporate Innovators, the book is a guide for challenging the status quo and building new ventures within the constraints of a large organization. They need to create new growth without damaging the company’s existing brand and are seeking robust evidence to justify current and future investments. The advice here resonates with those who understand the need for dedicated teams capable of generating their own evidence.
Startup Entrepreneurs will find this book invaluable for testing the fundamental building blocks of their business model. Their primary motivation is to avoid wasting the limited time, energy, and money of their team, cofounders, and investors. They recognize the perils of prematurely scaling a company that isn’t ready and seek strong evidence to ensure they are on the right track, making wise decisions about limited resources.
Solopreneurs, those with a side hustle or an idea that hasn’t fully become a business, are also a key audience. They are looking to make their late nights and weekends “worth it” by validating their ideas. The book addresses their desire to eventually devote all their time to an idea, providing the necessary evidence to make that risky leap and confirm they are “onto something big.” Regardless of the reader’s specific role, the book aims to provide guidance on how to test ideas and what types of experiments to run, moving beyond traditional methods like focus groups and surveys.
The Journey from Idea to Validated Business
This section outlines the overarching process of developing a business idea, emphasizing the crucial role of Search & Testing before committing to full Execution. Many entrepreneurs and innovators make the mistake of launching ideas prematurely because they look good in presentations, spreadsheets, or business plans, only to discover their vision was a “hallucination.”
The entrepreneur’s and innovator’s #1 task is to reduce risk and uncertainty. This is achieved through the Search & Testing phase, which involves continuously learning and adapting through rapid experiments. The book divides this phase into two key stages: Discovery and Validation. Discovery focuses on determining if the general direction is correct, testing basic assumptions, and gaining initial insights for rapid course correction. This stage involves collecting weaker evidence to explore broad possibilities. Validation, conversely, aims to confirm the chosen direction with stronger evidence, ensuring the business idea is highly likely to succeed before scaling. This iterative process prevents wasting resources on unproven concepts. The visual representation clearly shows Uncertainty & Risk decreasing as one moves from the “Idea” stage through “Search & Testing” and finally to “Execution.” This systematic approach, guided by the extensive experiment library within the book, is designed to make ideas “bulletproof.”
The Iterative Process: Design, Test, Learn
This section introduces the core iterative loop that drives the development of business ideas: Design and Test. It illustrates how vague ideas and market insights are transformed into concrete Value Propositions and solid Business Models. The iterative nature means that insights from testing constantly feed back into the design process, leading to continuous refinement.
The Design loop has three steps:
- Ideate: This expansive thinking phase is about generating as many alternative ways as possible to leverage an initial intuition or testing insights to create a strong business. The key is to avoid falling in love with your first ideas.
- Business Prototype: In this phase, alternatives from ideation are narrowed down using prototypes. Initially, these might be rough, like napkin sketches. As ideas become clearer, tools like the Value Proposition Canvas and Business Model Canvas are used to make them tangible and break them into smaller, testable chunks. Insights from the testing loop continuously improve these prototypes.
- Assess: The final step of the design loop involves evaluating the business prototypes. Questions are asked about whether the design effectively addresses customer jobs, pains, and gains, optimizes monetization, or incorporates learnings from testing. Only when satisfied with the design does one move to the testing loop, or return to testing for further iterations.
Testing and Reducing Risk: Desirability, Feasibility, Viability
This section delves into the three fundamental types of risk that every big business idea faces and how the testing process addresses them: Desirability, Feasibility, and Viability. To effectively test a broad business idea, it must first be broken down into smaller, testable hypotheses, each addressing one of these risk categories.
The three types of risk are:
- Desirability risk: This is the risk that customers aren’t interested in your idea. It encompasses concerns about the market being too small, too few customers wanting the value proposition, or the company’s inability to reach, acquire, and retain targeted customers. The core question is: “Do they want this?”
- Feasibility risk: This addresses whether “We can’t build and deliver” the idea. It’s the risk that a business won’t be able to access key resources (technology, intellectual property, brand), develop the necessary capabilities to perform key activities, or find crucial key partners to build and scale the value proposition. The core question is: “Can we do this?”
- Viability risk: This is the risk that “We can’t earn enough money.” It refers to the inability to generate successful revenue streams, customers being unwilling to pay enough, or costs being too high to achieve a sustainable profit. The core question is: “Should we do this?”
The process involves testing the most important hypotheses with appropriate experiments, which generate evidence and insights that lead to learning and decision-making. Based on this evidence, the idea is either adapted (if the wrong path was taken) or further aspects are tested (if the evidence supports the current direction). This systematic approach significantly reduces uncertainty and risk.
The Testing Flow: From Hypothesis to Action
This section presents a detailed diagram of the iterative testing process, showing the continuous cycle of Hypothesize, Experiment, Learn, and Decide. It visually reinforces how each stage feeds into the next, driving progress and reducing risk.
The flow begins with Design, where ideas are shaped into a Business Prototype. From this prototype, specific Hypotheses are identified based on desirability, feasibility, and viability risks. These hypotheses then inform the Experiment phase, where tests are run to gather evidence. The collected data leads to the Learn phase, where evidence is analyzed to generate Insights. Finally, the Decide phase involves taking action based on these insights, which can mean pivoting the business model, persevering, or killing the idea. The process then loops back to Design or Hypothesize, ensuring continuous refinement. This cyclical nature is critical for systematically winning with small bets and finding a path to scale.
Section 1: Design
The “Design” section of the book is introduced with a quote emphasizing the importance of team strength. This section focuses on the foundational elements of setting up for successful experimentation: designing the right team and shaping the initial business idea. It establishes that even the most brilliant ideas require a solid structure and the right people to bring them to life and test them effectively. The two key components of this section are Design the Team and Shape the Idea.
Design the Team
This chapter, introduced with a quote from Phil Jackson, emphasizes that behind every successful new venture is a great team. Regardless of whether you’re at a startup, a corporation, or a solopreneur, a solid team is the “glue that holds it all together.” This chapter outlines three critical aspects of team design: Team Design itself (structure and skills), Team Behavior (how the team operates), and Team Environment (the external conditions enabling success), followed by Team Alignment.
Team Design: What Kind of Team Do We Need?
This section focuses on the structural aspects of a team needed to create a new business. A key component is having a Cross-Functional Skillset, meaning the team possesses all the core abilities to ship a product and learn from customers. A basic example includes design, product, and engineering, but other commonly required skills to test business ideas include Legal, Data, Sales, Marketing, and Research, and Finance. If certain skills are missing internally, teams should evaluate Access to Missing Skillsets through technological tools or external partners. Furthermore, Diversity is crucial for navigating uncertainty, as a lack of diverse experiences and perspectives can “bake biases right into the business.” Leaders should prioritize diversity from the outset, not as an afterthought. Successful businesses also benefit from Entrepreneurial Experience, as many entrepreneurs need several attempts before finding success, exemplified by Rovio’s Angry Birds.
Team Behavior: How Does Our Team Need to Act?
Beyond structure, how a team behaves is equally important. This section outlines six key behaviors that are leading indicators of team success in an entrepreneurial context:
- Data Influenced: Teams don’t need to be data-driven but must be data-influenced, allowing insights from data to shape the backlog and strategy.
- Experiment Driven: Teams must be willing to be wrong and experiment, crafting experiments to learn about their riskiest assumptions, not just focusing on feature delivery.
- Customer Centric: Knowing “the why” behind the work by being constantly connected to the customer, extending beyond just the new customer experience.
- Entrepreneurial: Moving fast and validating things with a sense of urgency, including creative problem-solving at speed.
- Iterative Approach: Aiming for a desired result through repeated cycles of operations, assuming the solution may not be known upfront.
- Question Assumptions: Willingness to challenge the status quo and test disruptive business models for big results, rather than always playing it safe.
The chapter also notes that teams typically grow and evolve their configuration over time as they move through experimentation, find product/market fit, build the right way, and scale. As experiment fidelity increases, so too does the need for a larger team, and conversely, uncertainty and risk decrease with progress.
Team Environment: How Can You Design an Environment for Your Team to Thrive?
Teams require a supportive environment where failure is not an option, but learning faster than the competition is the goal. Leaders must intentionally design this environment. Key aspects include:
- Dedicated: Teams need to be dedicated to the work, as multitasking across several projects will “silently kill any progress.” Small, dedicated teams make more progress than large, uncommitted ones.
- Funded: It’s unrealistic for teams to function without a budget. Experiments cost money, so teams should be incrementally funded using a venture-capital style approach, based on learnings shared during stakeholder reviews.
- Autonomous: Teams need space to own their work and should not be micromanaged. They should be given room to account for their progress toward the goal.
The company must also provide:
- Support (Leadership & Coaching): Facilitative leadership that leads with questions, not answers, is ideal. Coaches (internal or external) can guide teams, especially those new to a wide range of experiments beyond interviews and surveys.
- Access (Customers & Resources): Teams need direct access to customers to solve problems effectively, avoiding guessing. They also need sufficient physical or digital resources to make progress and generate evidence.
- Direction (Strategy & Guidance & KPIs): A clear strategy and guidance are essential to make informed pivot, persevere, or kill decisions. Without clear constraints on where they will play, teams will mistake being busy for making progress. Key Performance Indicators (KPIs) are crucial signposts to understand progress and justify investment.
Team Alignment: How Can You Ensure Your Team Members Are Aligned?
Team alignment is crucial from the outset to prevent issues later due to a lack of shared goals, context, and language. The Team Alignment Map, created by Stefano Mastrogiacomo, is a visual tool to prepare for action, hold productive meetings, and structure conversations. It helps identify perception gaps early on.
The Team Alignment Map includes essential discussion points:
- Define the Mission: What is the overall purpose?
- Define the Time Box: Set the duration for the agreement.
- Create Joint Team Objectives: What do we intend to achieve together?
- Identify Commitment Levels (Joint Commitments): Who does what?
- Document Joint Resources: What resources are needed to succeed?
- Write Down Biggest Risks (Joint Risks): What can prevent success?
- Describe How to Address Risks: Create new objectives and commitments to tackle risks.
- Describe How to Address Resource Constraints: Plan for resource limitations.
- Set Joint Dates and Validate: Establish shared timelines and confirm agreement.
Both Core Teams (dedicated, cross-functional individuals with product, design, and technology skills) and Supporting Teams (individuals from legal, safety, compliance, marketing, user research) are essential for successful alignment, ensuring adequate domain knowledge and know-how. The book concludes that this alignment prevents teams from being “misaligned without even knowing it.”
Shape the Idea
This chapter, introduced by Rita McGrath’s quote “Generating ideas is not a problem,” shifts focus from team formation to the iterative process of shaping a business idea. It acknowledges that while ideas may be plentiful, transforming them into a strong, testable business concept requires a structured approach. The emphasis is on the Design Loop, where vague intuitions and insights from testing are refined into concrete value propositions and solid business models.
Business Design: The Design Loop in Detail
The Design Loop is described as the activity of “shaping and reshaping your business idea to turn it into the best possible value proposition and business model.” Initial iterations are based on intuition, product ideas, technology, or market opportunities. Subsequent iterations are driven by evidence and insights from the testing loop, highlighting the continuous feedback mechanism.
The Design Loop consists of three key steps:
- Ideate: This is the generation phase, where expansive thinking is encouraged to conceive “as many alternative ways as possible” to build a strong business from an initial idea or insights. A crucial warning is given: “Don’t fall in love with your first ideas.”
- Business Prototype: This phase involves synthesizing possibilities and narrowing options to the most promising. Early on, this might involve rough napkin sketches. Later, the Value Proposition Canvas and Business Model Canvas are explicitly mentioned as tools to make ideas clear and tangible, breaking them into smaller, testable chunks. These prototypes are continuously improved with insights from testing.
- Assess: In this final step of the design loop, the prototypes are evaluated. Questions are asked like: “Is this the best way to address our customers’ jobs, pains, and gains?” or “Is this the best way to monetize our idea?” or “Does this best take into account what we have learned from testing?” Once the design is deemed satisfactory, the team moves to testing in the field or back to testing for further iterations.
The book explicitly states a caveat: while it focuses on “Testing Business Ideas” and provides an experiment library, readers interested in deeper business design are encouraged to consult “Business Model Generation” (Wiley, 2010) and “Value Proposition Design” (Wiley, 2014) or their free online material, reinforcing that those books provide the foundational tools that this book helps validate.
The Business Model Canvas: Defining Desirability, Feasibility, and Viability
This section provides a synopsis of the Business Model Canvas, a strategic management tool used to “design, test, and manage risk” by shaping ideas into a comprehensive business model. It emphasizes that proficiency in the canvas isn’t required to use this book, but understanding its components is vital for defining the desirability, feasibility, and viability of an idea. For deeper understanding, “Business Model Generation” is recommended.
The Business Model Canvas is broken down into nine essential building blocks:
- Customer Segments: Describes the different groups of people or organizations targeted.
- Value Propositions: The bundle of products and services that create value for a specific customer segment.
- Channels: How a company communicates with and reaches customer segments to deliver the value proposition.
- Customer Relationships: The types of relationships a company establishes with specific customer segments.
- Revenue Streams: The cash a company generates from each customer segment.
- Key Resources: The most important assets required for the business model to work.
- Key Activities: The most important things a company must do to make its business model work.
- Key Partners: The network of suppliers and partners that enable the business model.
- Cost Structure: All costs incurred to operate the business model.
The book explicitly links these blocks to the three types of risk:
- Desirability Hypotheses (Market Risk): Explored first, these relate to the Value Proposition, Customer Segments, Channels, and Customer Relationships. They address whether customers want the idea, if the market is big enough, and if the company can reach and retain them.
- Feasibility Hypotheses (Infrastructure Risk): Explored second, these relate to Key Partners, Key Activities, and Key Resources. They address whether the business can build and deliver the idea, manage resources, and find necessary partners.
- Viability Hypotheses (Financial Risk): Explored third, these relate to Revenue Streams and Cost Structure. They address whether the business can generate sufficient revenue to cover costs and make a profit.
The Value Proposition Canvas: Deepening Customer Understanding
Similar to the Business Model Canvas, this section provides a synopsis of the Value Proposition Canvas, a tool referenced for “framing your experimentation, especially with regard to understanding the customer and how your products and services create value.” For deeper understanding, “Value Proposition Design” is recommended.
The Value Proposition Canvas is comprised of two parts: the Customer Profile and the Value Map.
The Customer Profile (Right Side) describes a specific customer segment in a structured and detailed way:
- Customer Jobs: What customers are trying to get done in their work and lives (tasks, problems solved, needs met).
- Gains: The outcomes customers want to achieve or the concrete benefits they are seeking.
- Pains: The bad outcomes, risks, and obstacles related to customer jobs.
The Value Map (Left Side) describes the features of a specific value proposition in a structured and detailed way:
- Products and Services: A list of what the value proposition is built around.
- Gain Creators: How products and services create customer gains.
- Pain Relievers: How products and services alleviate customer pains.
The book explains that the Value Proposition Canvas contains market risk in both the Value Map and Customer Profile, making it crucial for defining desirability hypotheses. By using this canvas, teams can identify specific assumptions about customer jobs, pains, and gains, and how their proposed solutions address them, providing a clear foundation for testing.
Section 2: Test
The “Test” section is introduced with a powerful quote from Richard Feynman: “It doesn’t matter how beautiful your theory is, it doesn’t matter how smart you are. If it doesn’t agree with experiment, it’s wrong.” This sets the stage for the core operational phases of testing business ideas, emphasizing the scientific rigor required to validate or invalidate hypotheses. This section covers Hypothesize, Experiment, Learn, Decide, and Manage, outlining the practical steps for executing the testing loop.
Hypothesize
This chapter focuses on the crucial first step in the testing loop: transforming assumptions into testable hypotheses. It outlines a two-step process: identifying and prioritizing these hypotheses.
1. Identify the Hypotheses Underlying Your Idea
To test a business idea effectively, one must first “make explicit all the risks that your idea won’t work.” This involves converting the underlying assumptions into clear, testable hypotheses.
A Hypothesis is defined as:
- An assumption that your value proposition, business model, or strategy builds on.
- What you need to learn about to understand if your business idea might work.
When creating a good business hypothesis, the book recommends starting with the phrase “We believe that…” For example, “We believe that millennial parents will subscribe to monthly educational science projects for their kids.” However, a crucial warning is issued about confirmation bias: always trying to prove what you believe. To counter this, teams should also create a few hypotheses that try to disprove their assumptions. For example, “We believe that millennial parents won’t subscribe to monthly educational science projects for their kids.” These competing hypotheses can even be tested simultaneously, especially when team members disagree on what to test.
A well-formed business hypothesis should have three characteristics:
- Testable: It can be shown true (validated) or false (invalidated) based on evidence.
- Precise: You know what success looks like, ideally describing the “what, who, and when” of your assumptions.
- Discrete: It describes only one distinct, testable, and precise thing to investigate.
Examples of good, precise, and discrete hypotheses are provided, such as: “We believe millennial parents with kids ages 5–9 will pay $15 a month for curated science projects that match their kids’ education level.”
Types of Hypotheses
Hypotheses are categorized into the three core risks:
- Desirable: “Do they want this?” (Market risk related to customer segments, value propositions, channels, customer relationships).
- Feasible: “Can we do this?” (Infrastructure risk related to key activities, key resources, key partners).
- Viable: “Should we do this?” (Financial risk related to revenue streams, cost structure, profit).
The book then provides detailed examples of these types of hypotheses as they apply to specific components of the Value Proposition Canvas and Business Model Canvas:
- Desirability Hypotheses (Market Risk – Explore first): Focus on customer jobs, pains, gains, value proposition fit, target segments, and ability to reach/retain customers through channels and relationships.
- Feasibility Hypotheses (Infrastructure Risk – Explore second): Focus on the ability to perform key activities, secure key resources, and create necessary key partnerships.
- Viability Hypotheses (Financial Risk – Explore third): Focus on generating sufficient revenue streams from customer willingness to pay, managing costs, and achieving sustainable profit.
2. Prioritize Most Important Hypotheses
This section details the Assumptions Mapping exercise, a team activity where desirability, viability, and feasibility hypotheses are made explicit and prioritized. The core team (cross-functional with product, design, and technology skills) and supporting team (legal, safety, compliance, etc.) should be present.
How to Facilitate Assumptions Mapping:
- Step 1: Identify Hypotheses: Write down each desirability, feasibility, and viability hypothesis on a separate sticky note. Use different colors for each type. Keep them specific, short, and precise.
- Step 2: Prioritize Hypotheses: Place all hypotheses on the Assumptions Map, a 2×2 matrix with an x-axis for Evidence (Have Evidence to No Evidence) and a y-axis for Importance (Unimportant to Important).
- Top Left (Share): Hypotheses that are important and have existing evidence. These should be checked and confirmed with the team.
- Top Right (Experiment): This is the focus for near-term experimentation. These are important hypotheses for which there is no concrete evidence from the field. If proven false, these will “make or break your business.”
- Bottom Left: Unimportant and have evidence (low priority).
- Bottom Right: Unimportant and no evidence (low priority).
- Step 3: Identify and Prioritize Riskiest Hypotheses: Systematically move desirability, then feasibility, then viability hypotheses onto the map. The major focus of this book is on testing the Top Right quadrant, as these assumptions, if proven false, “will cause your business to fail.”
Experiment
This chapter, featuring Richard Feynman’s quote, emphasizes that “Experiments are the means to reduce the risk and uncertainty of your business idea.” It details the practical aspects of transforming hypotheses into actionable tests and running them effectively. The chapter focuses on two main steps: Designing Experiments and Running Experiments.
1. Design Experiment
The process begins by taking the most important hypotheses from the top right quadrant of the Assumptions Map and turning them into experiments. The book stresses the importance of starting with cheap and fast experiments to learn quickly, as “Every experiment will reduce the risk that you’ll spend time, energy, and money on ideas that won’t work.”
A well-formed business experiment has four key components, typically captured on a Test Card:
- Hypothesis: The specific critical hypothesis being tested.
- Experiment: A clear description of the experiment to be run to support or refute the hypothesis.
- Metrics: The specific data to be measured as part of the experiment.
- Criteria: The predefined success criteria for the experiment metrics.
A good experiment is precise enough for team members to replicate and generate usable, comparable data, clearly defining the “who” (test subject), “where” (test context), and “what” (test elements). The concept of a Call-to-Action Experiment is introduced as a specific type of experiment that prompts observable action to test hypotheses.
The chapter highlights the importance of creating multiple experiments for a single hypothesis. Success rarely comes from one breakthrough experiment; it typically requires a series of tests to build a successful business. This iterative approach helps refine understanding.
2. Run Experiment
Once designed, every experiment has a specific run time to generate sufficient evidence. The book advises running experiments “almost like a scientist” to ensure the evidence is “clean and not misleading.”
The chapter concludes by illustrating how experiments reduce the risk of uncertainty. Instead of long internal development cycles in a “customer-free zone,” experiments enable incremental risk reduction over time. This ensures that development occurs “at the right time and at the right fidelity,” meaning Experiment Fidelity (the level of detail and realism of the test) increases as Uncertainty & Risk decrease, indicating Progress.
Learn
Introduced by Alain de Botton’s quote, “Anyone who isn’t embarrassed by who they were last year probably isn’t learning enough,” this chapter focuses on how to extract valuable insights from the evidence gathered during experiments. It emphasizes that raw data doesn’t speak for itself; it requires careful analysis and interpretation to become actionable learning. The chapter outlines two steps: Analyze the Evidence and Gain Insights.
1. Analyze the Evidence
After running experiments, the first step is to gather and analyze the evidence. It’s crucial to distinguish between strong and weak evidence.
Evidence is defined as:
- Data generated from an experiment or collected in the field.
- Facts that support or refute a hypothesis.
- Potentially of different nature (e.g., quotes, behaviors, conversion rates, orders, purchases) and can be weak or strong.
The Strength of Evidence is evaluated across four areas:
- Weak Evidence (Opinions/What people say/Lab settings/Small investments):
- Opinions (beliefs): Phrases like “I would…” or “I think…”
- What people say: What people state in interviews or surveys may not reflect real-life actions.
- Lab settings: People may behave differently when aware they are being tested.
- Small investments: Signing up for an email is weak evidence of interest.
- Strong(er) Evidence (Facts/What people do/Real world settings/Large investments):
- Facts (events): “Last week I…” or “I spent…”
- What people do: Observable behavior is generally a good predictor of future action.
- Real world settings: The most reliable predictor is observing people when they are unaware of being tested.
- Large investments: Pre-purchasing a product or risking professional reputation.
The chapter visually demonstrates how different experiments create different evidence by showing examples from Customer Interviews (transcripts & quotes), Search Trend Analysis (search volume data), and Concierge experiments (time to create, cost to create, customer satisfaction). This highlights that while Customer Interviews provide qualitative insights, they are weaker evidence compared to observed behavior or actual transactions.
2. Gain Insights
Insights are defined as:
- What you learn from studying the evidence.
- Learning related to the validity of a hypothesis and potential discovery of new directions.
- The foundation to make informed business decisions and take action.
The chapter emphasizes that evidence does not speak on its own and the critical importance of gleaning insights from it. Visual examples show how raw data (transcripts, search volume, concierge data) transforms into meaningful insights through analysis.
The concept of Confidence Level is introduced to indicate how much you believe your evidence is strong enough to support or refute a hypothesis. Three dimensions help determine confidence:
- Type and strength of evidence: Stronger evidence (e.g., a purchase) leads to higher confidence than weaker evidence (e.g., a quote).
- Number of data points per experiment: More data points generally increase confidence, though 100 accurate quotes might be better than 100 anonymous survey responses.
- Number and type of experiments conducted for the same hypothesis: Confidence increases with multiple experiments, especially when progressing to experiments with increasing strength of evidence (e.g., interviews to surveys to simulated sales).
The chapter provides a scale for Hypothesis Confidence Level:
- Very Confident: Several experiments, including at least one call-to-action test with very strong evidence.
- Somewhat Confident: Several experiments with strong evidence or one particularly strong call-to-action experiment.
- Not Really Confident: Only interviews or surveys where people state what they would do.
- Not Confident at All: Only one experiment producing weak evidence (e.g., interview or survey).
This framework helps teams objectively assess their learning and determine if they have enough reliable evidence to move forward.
Decide
This chapter, introduced by Indira Gandhi’s call for a “bias toward action,” emphasizes that learning faster than everyone else is no longer enough; that learning must be put into action quickly because insights have an expiration date. Markets and technology move rapidly, making timely decision-making crucial.
“Action” is defined as:
- Next steps to make progress with testing and de-risking a business idea.
- Informed decisions based on collected insights.
- Decisions to abandon, change, and/or continue testing a business idea.
The chapter outlines three primary decisions that can be made based on the evidence and insights gathered:
- Persevere: This is the decision to continue testing an idea because the evidence and insights support its direction. This might mean further testing the same hypothesis with a stronger experiment (higher fidelity) or moving on to the next most important hypothesis on the Assumptions Map.
- Pivot: This involves making a significant change to one or more elements of your idea, value proposition, or business model. A pivot often implies that earlier evidence might become irrelevant, and usually requires retesting elements of the business model, even those previously tested.
- Kill: This is the decision to abandon an idea entirely based on evidence and insights. The evidence might clearly show that the idea won’t work in reality, or that its profit potential is insufficient to justify further investment.
The chapter presents a visual decision-making flow, illustrating how hypotheses, evidence, insights, and action are interconnected. The decision tree for the “Decide” phase is as follows:
- If Evidence Supports Hypothesis:
- Test next critical hypothesis.
- Continue with the same hypothesis, but with a next experiment of higher fidelity.
- If Unclear Insight:
- Continue testing (meaning more experiments are needed).
- If Evidence Refutes Hypothesis:
- Kill the idea.
- Pivot the idea.
- If New Insight (unexpected learning):
- Kill the idea.
- Pivot the idea.
- Persevere with the idea (adjusting the path based on the new insight).
This framework ensures that decisions are evidence-driven, allowing teams to adapt quickly and avoid wasting resources on unviable paths.
Manage
Introduced by George Bernard Shaw’s quote on the illusion of communication, this chapter focuses on systematizing the testing process to ensure smooth collaboration and continuous progress. It emphasizes that successful new businesses require more than just a single experiment; they need a repeatable process driven by structured ceremonies. The chapter draws inspiration from agile, design thinking, and lean methodologies.
Experiment Ceremonies
These structured meetings help create a repeatable process, with each ceremony informing the next.
- Planning (Weekly, 30-60 min): Core Team. Plan and task out experiments for the upcoming week. Agenda: Hypotheses to Test, Experiment Prioritization, Experiment Tasking.
- Standup (Daily, 15 min): Core Team. Stay aligned and focus on daily work. Agenda: Daily Goal, How to Achieve That Goal, What’s in the Way (blockers).
- Learning (Weekly, 30-60 min): Core Team, Extended Team. Interpret evidence and turn it into action, informing overall strategy. Agenda: Gather Evidence, Generate Insights, Revisit Your Strategy.
- Retros (Biweekly, 30-60 min): Core Team. Reflect on how to improve the way you work. Agenda: What’s Going Well, What Needs Improvement, What to Try Next.
- Deciding (Monthly, 60-90 min): Stakeholders, Extended Team, Core Team. Keep stakeholders informed on pivoting, persevering, or killing the idea. Agenda: What You’ve Learned, What’s Blocking Progress, Pivot/Persevere/Kill Decision.
Considerations for Ceremonies:
- Co-Located or Distributed: These ceremonies work for both. Co-located teams benefit from semi-private spaces; distributed teams should use video chat and real-time editing software.
- Time Commitment: The time commitment is modest, with the Core Team spending about 9% of their working time on ceremonies, and Extended Team/Stakeholders significantly less, making it a sustainable investment.
- Team-Specific Advice: Practical tips are provided for Corporate, Startup, and Solopreneur teams on how to adapt each ceremony to their unique contexts, e.g., how Corporate Teams handle external issues, how Startup Teams build culture, and how Solopreneurs maintain organization.
Principles of Experiment Flow
Beyond ceremonies, three principles help achieve “flow” in experimentation, generating evidence for informed investment decisions, drawing inspiration from lean and Kanban.
- Visualize Your Experiments: Make work visible using an experiment board (Backlog, Setup, Run, Learn columns). Each experiment on a sticky note. This helps prevent work from getting stuck in people’s heads.
- Limit Experiments in Progress: Avoid multitasking too many experiments simultaneously, which slows down the process. Define “work in progress” (WIP) limits (e.g., a limit of 1 for Setup, Run, and Learn columns). This ensures experiments flow sequentially, informing the next.
- Continuous Experimentation: The team should continuously adapt and improve their experimentation process over time. This includes identifying Blocker Experiments (external obstacles, like internal policies, preventing progress) and considering Splitting Columns (e.g., adding “Waiting” sub-columns) as the team outgrows simpler boards.
Ethics in Experimentation
The chapter includes a crucial section on ethics, emphasizing: “Are you experimenting with your customers or on them?” It warns against using experimentation as a pretext for “scamming people out of their money” or creating “Vaporware” (products promised but never launched). In an era of fake news, techniques can be “weaponized as propaganda,” so context is vital. The core message is: “don’t be evil.”
Experiment Guidelines
To address poor communication and ensure consistency, teams should craft Experiment Guidelines to communicate details and “the why” to those outside the team, especially legal, safety, and compliance departments. A sample guideline includes: customer segment, total number of customers, experiment run dates, information currency collected, branding used, financial exposure, and how to turn off the experiment. This helps streamline approval processes and clarifies expectations.
Section 3: Experiments
The “Experiments” section begins with jazz musician Herbie Hancock’s encouraging words: “The problem happens when you don’t put that first note down. Just start!” This section is the practical core of the book, providing a comprehensive library of 44 specific experiments. It guides the reader through selecting the right experiment and then dives into detailed descriptions of both Discovery and Validation experiments, offering actionable guidance for each.
Select an Experiment
This chapter provides a framework for choosing the most appropriate experiment from the library. It emphasizes that selecting the “right experiment” depends on three key questions:
- Type of hypothesis: What major learning objective are you pursuing (desirability, feasibility, or viability)? Some experiments are better suited for specific hypothesis types.
- Level of uncertainty: How much evidence do you already have for this hypothesis? The less you know, the cheaper and faster your experiments should be, even if they yield weaker evidence. As knowledge increases, stronger (often more costly and lengthier) evidence is needed.
- Urgency: How much time remains until the next major decision point (e.g., investor meeting, funding run-out)? This dictates the speed and cost of experiments you can conduct.
The chapter provides Rules of Thumb for experiment selection:
- Go cheap and fast at the beginning: When knowledge is low, prioritize quick and inexpensive experiments that still aim for direction, even if evidence is weaker.
- Increase the strength of evidence with multiple experiments for the same hypothesis: Don’t make important decisions based on a single, weak experiment. Run several experiments to confirm findings.
- Always pick the experiment that produces the strongest evidence given your constraints: Optimize for the strongest possible evidence within your time, budget, and resource limitations.
- Reduce uncertainty as much as you can before you build anything: Don’t assume building is the only way to test. The more costly the build, the more essential it is to run multiple experiments first to confirm customer jobs, pains, and gains.
Visual “Experiment Selection” charts are provided, categorizing experiments by THEME (Exploration, Data Analysis, Interest Discovery, Discussion Prototypes, Preference & Prioritization for Discovery; Interaction Prototypes, Call to Action, Simulation for Validation), showing their COST, SETUP TIME, EVIDENCE STRENGTH, and RUN TIME. Each experiment is also labeled with its primary suitability for DESIRABILITY, FEASIBILITY, or VIABILITY testing.
The chapter introduces the concept of Experiment Sequences, going beyond individual pairings to suggest how teams can “gain momentum and build up stronger evidence over time with a series of experiments.” Examples include specific sequences for B2B Software, B2B Services, B2B Hardware, B2C Hardware, B2C Software, B2B2C with B2C, and Highly Regulated contexts, showing how different experiments can logically follow each other.
Discovery Experiments
This section provides a detailed breakdown of various experiments primarily focused on the Discovery phase – “Discover if your general direction is right. Test basic assumptions. Get first insights to course correct rapidly.” The experiments are categorized by theme to help readers select the most appropriate method for their learning goals.
Exploration Experiments:
These qualitative methods help teams gain deep empathy and initial insights into customer needs.
- Customer Interview (p. 106): An interview focused on exploring customer jobs, pains, gains, and willingness to pay.
- Ideal for: Gaining qualitative insights into value proposition and customer segment fit, and for initial price testing.
- Details: Low cost, 1-3 weeks setup, 1-3 days run time. Requires research skills. Focus on narrow target audience. Involves a script (introduction, story, ranking jobs/pains/gains, thanks/wrap up), finding interviewees (B2C/B2B channels, vetting via screeners), and roles (interviewer, scribe). Evidence strength is relatively weak (what people say), but great for qualitative insights.
- Pairings: Before: Discussion Forums, Sales Force Feedback, Discovery Survey, Search Trend Analysis. After: A Day in the Life, Paper Prototype.
- Partner & Supplier Interviews (p. 114): Similar to Customer Interviews but focused on feasibility.
- Ideal for: Sourcing Key Partners to supplement Key Activities and Key Resources.
- Evidence strength: # of key partner bids and key partner feedback are relatively strong.
- Expert Stakeholder Interviews (p. 115): Similar to Customer Interviews but focused on internal “buy-in.”
- Ideal for: Aligning key players inside your organization.
- Evidence strength: Expert stakeholder feedback is moderately strong, but needs actions to be stronger.
- A Day in the Life (p. 116): Qualitative research using customer ethnography to understand jobs, pains, and gains.
- Ideal for: Observing actual customer behavior in real-world settings to learn if actions match words.
- Details: Relatively cheap, 1-3 days setup, 1-3 weeks run time. Requires research skills. Needs consent from participants. Evidence strength is relatively weak (observed behavior), but stronger than lab settings.
- Case Study: Intuit’s “Follow-Me-Home Program” exemplifies closing the say/do gap by observing customers installing software.
- Pairings: Before: Customer Support Analysis, Discussion Forums, Search Trend Analysis. After: Web Traffic Analysis, Social Media Campaign, Storyboarding.
- Discovery Survey (p. 122): Open-ended questionnaire for initial information gathering from a sample.
- Ideal for: Uncovering value proposition, customer jobs, pains, and gains.
- Details: Low cost, 1-3 hours setup, 1-3 days run time. Requires product/marketing/research skills. Best used with qualitative insights to inform design and requires access to an audience. Evidence strength is weak (what people say).
- Pairings: Before: Customer Interviews, Speed Boat. After: Paper Prototype, Clickable Prototype, Social Media Campaign, Search Trend Analysis.
Data Analysis Experiments:
These leverage existing data to uncover patterns and trends.
- Search Trend Analysis (p. 126): Investigating online searcher interactions to find trends.
- Ideal for: Performing market research, especially on newer trends.
- Details: Under $500, 1-3 hours setup, 1-3 days run time. Requires marketing/research/data skills. Best for online customers; niche or offline customers may yield low volume. Evidence strength is moderate (search volume, related queries).
- Pairings: Before: Customer Interviews, Discovery Survey, Discussion Forums. After: Online Ads, Simple Landing Page, Social Media Campaign.
- Web Traffic Analysis (p. 130): Using website data to find customer behavior patterns.
- Ideal for: Understanding user behavior flow and drop-off points on a website.
- Details: Under $500, 1-3 days setup, 1-3 weeks run time. Requires technology/data skills. Needs existing website traffic. Evidence strength is moderate to strong (sessions, drop-offs, attention), tells “what” but not “why.”
- Pairings: Before: Customer Support Analysis, Discussion Forums. After: Simple Landing Page, Split Testing, Extreme Programming Spike, Validation Survey, Single Feature MVP.
- Discussion Forums (p. 134): Uncovering unmet jobs, pains, and gains in products/services.
- Ideal for: Finding unmet needs in existing or competitor products.
- Details: Under $500, 1-3 hours setup, 1-3 days run time. Requires research/data skills. Needs existing discussion forum data. Evidence strength is moderate (workarounds) to weak (feature requests).
- Pairings: Before: Customer Support Analysis, Sales Force Feedback. After: Customer Interviews, Search Trend Analysis, Web Traffic Analysis.
- Sales Force Feedback (p. 138): Using sales team insights to uncover unmet needs.
- Ideal for: Businesses with a sales team to identify gaps in product-market fit.
- Details: Under $500, 1-3 hours setup, 1-3 days run time. Requires sales/research/data skills. Needs an engaged sales force. Evidence strength is moderate to strong (near misses) to weak (feature requests).
- Pairings: Before: Customer Interviews, Validation Survey, Expert Stakeholder Interviews. After: Buy a Feature, Split Test.
- Customer Support Analysis (p. 142): Using customer support data to uncover unmet jobs, pains, and gains.
- Ideal for: Businesses with substantial existing customers.
- Details: Under $500, 1-3 hours setup, 1-3 days run time. Requires sales/marketing/research/data skills. Needs existing customer support data. Evidence strength is weak (feedback, feature requests).
- Pairings: Before: Customer Interviews, Validation Survey, Expert Stakeholder Interviews. After: Web Traffic Analysis, Speed Boat.
Interest Discovery Experiments:
These tests gauge initial customer interest in a proposed value proposition.
- Online Ad (p. 146): Articulates a value proposition for a targeted segment with a call to action.
- Ideal for: Quickly testing value propositions at scale online.
- Details:
500−500-500−10,000, 1-3 hours setup, 1-3 days run time. Requires design/product/marketing skills. Needs a clear destination (landing page). Evidence strength is weak (clicks), but useful for acquisition channel testing. - Pairings: Before: Customer Interviews, Search Trend Analysis, Product Box. After: Social Media Campaign, Simple Landing Page, Split Testing.
- Link Tracking (p. 152): Unique, trackable hyperlinks to gain detailed information.
- Ideal for: Testing customer actions to gather quantitative data.
- Details: Under $500, 1-3 hours setup, 1-3 weeks run time. Requires technology/data skills. Needs a clear call to action. Evidence strength is moderate (click rate).
- Pairings: Before: Customer Interviews, Email Campaign. After: Online Ad, Simple Landing Page, Split Test.
- Feature Stub (p. 156): Small test of an upcoming feature, usually a button.
- Ideal for: Rapidly testing the desirability of a new feature in an existing offering.
- Details: Under $500, 1-3 hours setup, 1-3 days run time. Requires design/product/technology skills. Needs an existing product with daily active users and analytics. Evidence strength is weak to moderate (button clicks, survey completions).
- Pairings: Before: Buy a Feature, Customer Support Analysis, Discussion Forums. After: Paper Prototype, Clickable Prototype.
- 404 Test (p. 160): A riskier Feature Stub where a click leads to a 404 error.
- Ideal for: Extremely rapid, large-scale testing of feature desirability (do not use for mission-critical features).
- Details: Under $500, 1-3 hours setup, 1-3 hours run time.
- Considerations: Gives impression of broken product, so run for very short periods.
- Email Campaign (p. 162): Messages deployed over time to customers.
- Ideal for: Quickly testing value propositions with a customer segment.
- Details: Under $500, 1-3 hours setup, 1-3 weeks run time. Requires design/product/marketing skills. Needs a subscriber list and a campaign goal. Evidence strength is moderate (opens, clicks).
- Case Study: Product Hunt’s initial launch as an email campaign.
- Pairings: Before: Simple Landing Page, Explainer Video. After: Link Tracking, Social Media Campaign, Split Testing, Concierge.
- Social Media Campaign (p. 168): Messages deployed over time to customers on social media.
- Ideal for: Acquiring new customers, increasing brand loyalty, driving sales.
- Details:
500−500-500−10,000, 1-3 days setup, 1-3 weeks run time. Requires design/marketing skills. Needs content. Evidence strength is weak (engagement) to strong (conversions). - Pairings: Before: Explainer Video, Simple Landing Page. After: Concierge.
- Referral Program (p. 172): Promoting products/services to new customers via referrals.
- Ideal for: Testing organic business scaling with customers.
- Details:
500−500-500−1,000, 1-3 hours setup, 1-3 weeks run time. Requires design/product/marketing skills. Needs passionate customers. Evidence strength is strong (advocates sharing, friends converting). - Pairings: Before: Link Tracking, Simple Landing Page. After: Split Test, Email Campaign, Social Media Campaign.
Discussion Prototypes:
These create low-fidelity representations to facilitate conversations and gather feedback.
- 3D Print (p. 176): Rapidly prototyping a physical object from a 3D digital model.
- Ideal for: Rapidly testing physical solution iterations with customers.
- Details:
500−500-500−1,000, 1-3 days setup, 1-3 hours run time. Requires design/technology skills. Needs sketches to model. Evidence strength is weak (customer feedback), as it requires suspending belief. - Case Study: NSA’s use of 3D prints to validate a CubeSat cryptographic device.
- Pairings: Before: Paper Prototype, Pretend to Own, Storyboarding. After: Life-Sized Prototype, Customer Interviews, Partner & Supplier Interviews, Data Sheet.
- Paper Prototype (p. 182): Sketched interface on paper, manipulated to simulate software reactions.
- Ideal for: Rapidly testing product concepts with customers at low fidelity.
- Details: Under $500, 1-3 hours setup, 1-3 days run time. Requires design/research skills. Needs an imagined product. Evidence strength is weak (task completion, customer feedback).
- Pairings: Before: Customer Interviews, Card Sorting, Boomerang. After: Clickable Prototype, Storyboarding, Explainer Video.
- Storyboard (p. 186): Illustrations displayed in sequence to visualize an interactive experience.
- Ideal for: Brainstorming scenarios of value propositions and solutions with customers.
- Details: Under $500, 1-3 hours setup, 1-3 hours run time. Requires design/research skills. Best with a specific customer segment. Evidence strength is weak (illustrations, customer feedback), useful for informing higher fidelity tests.
- Pairings: Before: Product Box, Boomerang, Social Media Campaign. After: Paper Prototype, Explainer Video, Customer Interviews.
- Data Sheet (p. 190): One-page physical or digital sheet with specifications of a value proposition.
- Ideal for: Distilling specifications for testing with customers and key partners.
- Details: Under $500, 1-3 hours setup, 1-3 hours run time. Requires design/technology/marketing skills. Needs specifications and a specific value proposition. Evidence strength is weak (feedback).
- Pairings: Before: Product Box, Paper Prototype, Customer Interviews, Partner & Supplier Interviews. After: Simple Landing Page, 3D Print, Presale.
- Brochure (p. 194): Mocked up physical brochure of an imagined value proposition.
- Ideal for: Testing value propositions in-person with hard-to-find online customers.
- Details: Under $500, 1-3 days setup, 1-3 hours run time. Requires marketing/research skills. Needs an acquisition plan. Evidence strength is moderate (conversion rates from call-to-action).
- Case Study: American Family Insurance testing new risk protection offerings with farmers.
- Pairings: Before: Customer Interviews, Buy a Feature, Product Box. After: Presale, Concierge, Validation Survey.
- Explainer Video (p. 200): Short video explaining a business idea simply.
- Ideal for: Quickly explaining value propositions at scale to customers.
- Details:
500−500-500−10,000, 1-3 days setup, 1-3 weeks run time. Requires design/product/technology skills. Needs traffic. Evidence strength is weak (views, shares) to moderate (clicks, comments). - Pairings: Before: Data Sheet, Storyboarding, Card Sorting. After: Email Campaign, Simple Landing Page, Pretend to Own.
- Boomerang (p. 204): Customer test on an existing competitor’s product to gather insights.
- Ideal for: Finding unmet needs in an existing market without building anything.
- Details: Under $500, 1-3 hours setup, 1-3 hours run time. Requires product/marketing/research skills. Needs an existing product to test. Evidence strength is moderate to strong (task completion) to weak (customer feedback).
- Considerations: Advises against rebranding competitor products (Imposter Judo) due to legal/ethical risks.
- Pairings: Before: Discussion Forums, Search Trend Analysis, Customer Interviews. After: Buy a Feature, Paper Prototype, Clickable Prototype.
- Pretend to Own (p. 208): Nonfunctioning, low-fidelity prototype to determine fit into daily life (Pinocchio experiment).
- Ideal for: Generating personal evidence on an idea’s potential usefulness.
- Details: Under $500, 1-3 hours setup, 1-3 weeks run time. Requires design/research skills. Needs only an idea and creativity. Evidence strength is weak (engagement logbook).
- Case Study: Jeff Hawkins’ wooden Palm Pilot.
- Pairings: Before: Storyboarding, Customer Interview, Data Sheet, Brochure. After: Life-Sized Prototype.
Preference & Prioritization Discovery Experiments:
These help understand what features or aspects customers value most.
- Product Box (p. 214): Facilitation technique for visualizing value propositions, features, and benefits as a physical box.
- Ideal for: Refining value propositions and narrowing down key features.
- Details: Under $500, 1-3 hours setup, 1-3 hours run time. Requires design/product/research skills. Needs an idea and target customer. Evidence strength is weak (artifacts, customer feedback).
- Pairings: Before: Customer Interviews, Boomerang, Social Media Campaign. After: Paper Prototype, Search Trend Analysis, Storyboarding.
- Speed Boat (p. 218): Visual game to identify what inhibits customer progress.
- Ideal for: Visually representing what slows customers down and impacts feasibility.
- Details: Under $500, 1-3 hours setup, 1-3 hours run time. Requires design/product/technology skills and facilitation skills. Best with existing product users. Evidence strength is weak (anchors, customer feedback).
- Pairings: Before: Discussion Forums, Sales Force Feedback, Search Trend Analysis. After: Split Test, Extreme Programming Spike, Storyboarding.
- Card Sorting (p. 222): Using cards with customers to generate insights on jobs, pains, gains.
- Ideal for: Getting insights into customer jobs, pains, gains, and value propositions.
- Details: Under $500, 1-3 hours setup, 1-3 hours run time. Requires marketing/research skills. Best with existing or target customers. Evidence strength is weak (grouping, ranking, customer feedback).
- Pairings: Before: Sales Force Feedback, Customer Support Analysis, Discussion Forums. After: Storyboarding, Explainer Video, Paper Prototype.
- Buy a Feature (p. 226): People use pretend currency to buy desired features.
- Ideal for: Prioritizing features and refining customer jobs, pains, gains.
- Details: Under $500, 1-3 days setup, 1-3 hours run time. Requires product/research/finance skills. Needs a feature list and target customer with context. Evidence strength is weak (feature ranking, customer feedback).
- Pairings: Before: Sales Force Feedback, Customer Support Analysis, Discussion Forums. After: Feature Stub, Split Test, Clickable Prototype.
Validation Experiments
This section provides a detailed breakdown of experiments primarily focused on the Validation phase – “Validate the direction you’ve taken. Confirm with strong evidence that your business idea is very likely to work.” These experiments are designed to generate stronger evidence than discovery experiments, moving beyond what people say to what they actually do or are willing to commit to.
Interaction Prototypes:
These involve higher-fidelity prototypes that customers can interact with.
- Clickable Prototype (p. 236): Digital interface with clickable zones to simulate software reactions.
- Ideal for: Rapidly testing product concepts with customers at higher fidelity than paper.
- Details:
500−500-500−1,000, 1-3 days setup, 1-3 days run time. Requires design/product/technology/research skills. Needs a digital product idea. Evidence strength is moderate (task completion, customer feedback), stronger than paper prototypes. - Pairings: Before: Customer Interviews, Paper Prototype, Boomerang. After: Mash-Up, Storyboarding, Explainer Video.
- Single Feature MVP (p. 240): A functioning minimum viable product with only the core feature.
- Ideal for: Learning if the core promise of your solution resonates with customers.
- Details:
1,000−1,000-1,000−10,000, 1-3 weeks setup, 1-3 weeks run time. Requires all core business capabilities. Needs evidence of niche customer need. Evidence strength is strong (customer satisfaction, purchases, cost of delivery). - Pairings: Before: Concierge, Wizard of Oz, Simple Landing Page. After: Customer Interviews, Validation Survey, Crowdfunding.
- Mash-Up (p. 244): A functioning MVP combining multiple existing services.
- Ideal for: Learning if a solution resonates with customers by leveraging existing tech.
- Details:
1,000−1,000-1,000−10,000, 1-3 weeks setup, 1-3 weeks run time. Requires all core business capabilities. Needs a process to automate. Evidence strength is strong (customer satisfaction, purchases, cost of delivery). - Pairings: Before: Concierge, Wizard of Oz, Simple Landing Page. After: Customer Interviews, Validation Survey, Crowdfunding.
- Concierge (p. 248): Delivering value manually, with people instead of technology, visibly to the customer.
- Ideal for: Learning firsthand about steps to create, capture, and deliver value.
- Details: Under $500, 1-3 days setup, 1-3 weeks run time. Requires all core business capabilities. Needs dedicated time commitment. Evidence strength is strong (customer satisfaction, purchases, time to complete process).
- Case Study: Realtor.com testing home buying/selling timing insights manually.
- Pairings: Before: Feature Stub, Brochure, Simple Landing Page. After: Mash-Up, Referral Program, Wizard of Oz.
- Life-Sized Prototype (p. 254): Real-world replicas of physical objects or service experiences.
- Ideal for: Testing higher-fidelity solutions with a small sample before scaling.
- Details:
1,000−1,000-1,000−10,000, 1-3 weeks setup, 1-3 days run time. Requires design/product skills. Needs significant evidence that a solution is needed. Evidence strength is moderate to strong (mock sales, email signups, customer feedback). - Case Study: Zoku validating micro-apartment designs.
- Pairings: Before: Buy a Feature, Data Sheet, Customer Interviews. After: Crowdfunding, Mock Sales, Explainer Video.
Call to Action Experiments:
These prompt customers to make a real commitment or express strong interest.
- Simple Landing Page (p. 260): A digital web page illustrating value proposition with a call to action.
- Ideal for: Determining if a value proposition resonates with a customer segment.
- Details: Under $500, 1-3 days setup, 1-3 weeks run time. Requires design/product/technology skills. Needs traffic. Evidence strength is weak (email signups), but important for initial validation.
- Considerations: Discusses branding concerns for corporate vs. startup.
- Pairings: Before: Online Ads, Customer Interviews. After: Customer Interviews, Validation Survey, Split Testing, Wizard of Oz.
- Crowdfunding (p. 266): Raising small amounts of money from many people, typically online.
- Ideal for: Funding new ventures with customers who believe in the value proposition.
- Details:
1,000−1,000-1,000−10,000, 1-3 weeks setup, 1-3 months run time. Requires design/product/marketing/finance skills. Needs clear value proposition and target customer. Evidence strength is very strong (pledges). - Pairings: Before: Online Ads, Social Media Campaign, Simple Landing Page. After: Customer Interviews, Single Feature MVP, Email Campaign.
- Split Test (p. 270): Comparing two versions (control A vs. variant B) to determine better performance.
- Ideal for: Testing different versions of value propositions, prices, and features.
- Details: Under $500, 1-3 hours setup, 1-3 weeks run time. Requires design/product/technology/data skills. Needs significant traffic. Evidence strength is moderate (conversion rates from customer actions).
- Pairings: Before: Online Ads, Brochure, Customer Interviews, Simple Landing Page, Email Campaign. After: Customer Interviews.
- Presale (p. 274): Sale held before an item is available, processing financial transaction upon shipment.
- Ideal for: Gauging market demand at a smaller scale before public launch.
- Details:
500−500-500−1,000, 1-3 hours setup, 1-3 weeks run time. Requires design/sales/finance skills. Needs ability to fulfill the promise. Evidence strength is strong (purchases, abandonment rates). - Pairings: Before: Online Ad, Simple Landing Page, Brochure. After: Wizard of Oz, Single Feature MVP, Concierge.
- Validation Survey (p. 278): Closed-ended questionnaire from a sample of customers about a specific topic.
- Ideal for: Gauging if customers would be disappointed if product went away (Sean Ellis Test) or would refer others (NPS).
- Details: Under $500, 1-3 hours setup, 1-3 days run time. Requires product/marketing/research skills. Needs quantitative source material and a channel to existing customers. Evidence strength is weak (Sean Ellis Test) to moderate (NPS, ranking accuracy).
- Pairings: Before: Simple Landing Page, Single Feature MVP, Wizard of Oz. After: Referral Program, Discovery Survey, Customer Interviews.
Simulation Experiments:
These create realistic scenarios to observe customer behavior or gain insights into operational feasibility.
- Wizard of Oz (p. 284): Manual delivery of value behind the scenes, invisible to the customer.
- Ideal for: Learning manually, firsthand, about steps to create, capture, and deliver value, without building out technology.
- Details: Under $500, 1-3 days setup, 1-3 weeks run time. Requires all core business capabilities. Needs time and a “digital curtain” to hide manual efforts. Evidence strength is very strong (customer satisfaction, purchases, time to complete process).
- Pairings: Before: Feature Stub, Brochure, Simple Landing Page. After: Mash-Up, Referral Program, Crowdfunding.
- Mock Sale (p. 288): Presenting a sale for your product without processing actual payment.
- Ideal for: Determining different price points for your product.
- Details:
500−500-500−1,000, 1-3 days setup, 1-3 weeks run time. Requires design/sales/finance skills. Needs a pricing strategy and believable fidelity. Evidence strength is strong (purchase clicks, email signups, payment info submissions). - Case Study: Buffer testing pricing tiers for their social media scheduling service.
- Pairings: Before: Online Ad, Simple Landing Page, Brochure. After: Customer Interviews, Single Feature MVP, Email Campaign.
- Letter of Intent (p. 294): Short, non-legally binding written contract.
- Ideal for: Evaluating key partners and B2B customer segments.
- Details: Under $500, 1-3 hours setup, 1-3 days run time. Requires product/technology/legal/finance skills. Needs warm leads. Evidence strength is strong (signatures, though non-binding) to weak (customer/partner feedback).
- Case Study: Thrive Smart Systems using LOIs with landscapers.
- Pairings: Before: Partner & Supplier Interviews, Customer Interviews, Life-Sized Prototype. After: Single Feature MVP, Presales.
- Pop-Up Store (p. 300): Temporary retail store to sell goods.
- Ideal for: Testing face-to-face interactions with customers and confirming purchase intent.
- Details:
1,000−1,000-1,000−10,000, 1-3 days setup, 1-3 days run time. Requires design/product/legal/sales/marketing skills. Needs traffic. Evidence strength is weak (visits, emails, feedback) to strong (sales). Not ideal for B2B. - Case Study: Topology Eyewear using a pop-up to learn about glasses fit problems.
- Pairings: Before: Online Ads, Customer Interviews, Social Media Campaign. After: Presales, Mock Sales, Concierge.
- Extreme Programming Spike (p. 306): Simple program to explore potential technical or design solutions (usually software).
- Ideal for: Quickly evaluating feasibility, usually with software.
- Details:
500−500-500−1,000, 1 day setup, 1-3 weeks run time. Requires product/technology/data skills. Needs defined acceptance criteria and time box. Evidence strength is strong (acceptance criteria met, recommendations). - Pairings: Before: Partner & Supplier Interviews, Boomerang, Data Sheet. After: Single Feature MVP.
Section 4: Mindset
The “Mindset” section of the book is prefaced by Vinod Khosla’s insightful quote: “The more success you’ve had in the past, the less critically you examine your own assumptions.” This section is crucial for cultivating the right leadership and organizational approach to foster effective experimentation, ensuring teams can navigate uncertainty, learn from failures, and ultimately achieve success. It addresses Avoiding Experiment Pitfalls, Leading Through Experimentation, and Organizing for Experiments.
Avoid Experiment Pitfalls
This chapter serves as a critical guide to common mistakes teams make when conducting experiments, allowing readers to learn from others’ errors and avoid them. It covers seven key pitfalls:
- Time Trap (Not dedicating enough time): Teams often underestimate the time required to test ideas well, leading to poor results.
- Solution: Carve out dedicated weekly time for testing, learning, and adapting. Set weekly learning goals and visualize work to identify stalled or blocked tasks.
- Analysis Paralysis (Overthinking things): Teams get caught in endless debates and overthinking rather than getting out to test.
- Solution: Time box analysis work. Differentiate between reversible (act fast) and irreversible (take more time) decisions. Conduct evidence-driven debates.
- Incomparable Data/Evidence (Messy data): Sloppy definition of hypotheses, experiments, and metrics leads to data that cannot be compared (e.g., testing different customer segments or contexts).
- Solution: Use the Test Card to make test subject, context, and precise metrics explicit. Ensure all involved in running the experiment participate in its design.
- Weak Data/Evidence (Only measuring what people say): Teams are content with surveys and interviews, failing to observe real-life actions.
- Solution: Don’t just believe what people say. Run call-to-action experiments to generate evidence as close as possible to real-world situations.
- Confirmation Bias (Only believing evidence that agrees with your hypothesis): Teams discard or downplay conflicting evidence, preferring the illusion of being correct.
- Solution: Involve others in data synthesis for diverse perspectives. Create competing hypotheses. Conduct multiple experiments for each hypothesis.
- Too Few Experiments (Conducting only one experiment): Teams make decisions on important hypotheses based on single, weak experiments.
- Solution: Conduct multiple experiments for important hypotheses. Differentiate between weak and strong evidence, increasing strength as uncertainty decreases.
- Failure to Learn and Adapt (Not taking time to analyze): Teams get lost in testing, forgetting the goal is to decide and progress.
- Solution: Set aside time to synthesize results, generate insights, and adapt ideas. Constantly navigate between detailed testing and the big picture. Create rituals to stay focused on progress from idea to business.
- Outsource Testing (Outsourcing what you should learn yourself): Rarely wise, as testing is about rapid iteration and agencies cannot make rapid decisions for you.
- Solution: Shift resources to internal team members and build up a team of professional testers.
Lead Through Experimentation
This chapter provides guidance for leaders on how to foster an experimentation culture, recognizing that leadership style and environment are crucial. It distinguishes between improving existing business models and inventing new ones.
Improving Business Models
For leaders improving existing models, the key is to be mindful of their language, tone, and accountability.
- Language: Avoid “I, Me, Mine” and direct commands. Instead, use “We, Us, Our” and ask questions like “How would you achieve this business outcome?” and “Can you think of 2 – 3 additional experiments?” This prevents unintentionally disempowering teams and fosters autonomous decision-making.
- Accountability: Shift from holding teams accountable for hitting dates and releasing features (outputs) to focusing on business outcomes. Create opportunities for teams to account for their progress through experimentation.
- Facilitation: Leaders need strong facilitation skills to guide teams in selecting multiple experiments and allowing evidence to shape the best approach, rather than imposing their own solutions.
Inventing Business Models
For leaders inventing new business models, the mindset shifts to embracing uncertainty and the possibility of being wrong.
- Strong Opinions, Weakly Held: Adopt Paul Saffo’s approach: start with a strong hypothesis (intuition-guided conclusion) but be open to proving it wrong. This counters cognitive biases and prevents frustrating meetings where leaders ignore contradictory data.
- Questions to Ask: Leaders should ask questions that encourage learning and adaptation, such as: “What is your learning goal?”, “What obstacles can I remove?”, “How else might we approach this problem?”, and “What learning has surprised you so far?” Avoid disempowering statements like “I don’t trust the data” or “We should build it anyway.”
Steps Leaders Can Take
This section outlines actionable steps leaders can take to support experimentation:
- Create an Enabling Environment: Provide sufficient time and resources for iterative testing. Abolish traditional business plans and establish appropriate testing processes and metrics that differ from execution metrics. Grant teams autonomy to make fast decisions.
- Remove Obstacles and Open Doors: Address internal roadblocks (lack of access to expertise, specialized resources) and facilitate access to customers (a common struggle for corporate innovation teams).
- Make Sure Evidence Trumps Opinion: Leaders must push teams to build compelling cases based on evidence, not personal preferences or past experience, especially in innovation where past success can hinder adaptation to the future.
- Ask Questions Rather Than Provide Answers: Develop strong questioning skills to push teams to build better value propositions and business models. Relentlessly inquire about experiments, evidence, insights, and patterns.
Create More Leaders
This section advises leaders on how to develop more leaders within their organization, emphasizing mentorship and modeling desired behaviors.
- Meet Your Teams One-Half Step Ahead: Guide teams along their journey by understanding their current stage and nudging them forward. Provide guidance in one-on-ones, retrospectives, or casual conversations.
- Understand Context Before Giving Advice: Practice active listening and ask clarifying questions before offering advice. Avoid interrupting or prematurely providing solutions.
- Say “I Don’t Know.”: Leaders should model humility by saying “I don’t know” when they genuinely don’t have the answer. This reduces pressure on themselves, fosters a culture where it’s okay to be wrong, and encourages teams to find their own solutions by asking, “How would you approach this?” or “What do you think we should do?” This behavior helps build a culture of innovation and entrepreneurship.
Organize for Experiments
This chapter, referencing W. Edwards Deming’s quote “A bad system will beat a good person every time,” focuses on the organizational structures and funding models necessary to support effective experimentation. It critiques outdated models and proposes modern alternatives.
Silos vs. Cross-Functional Teams
Traditional organizations are often structured like Industrial Era factories, with functional silos (e.g., Engineering, Design, Product separated). This works efficiently if the solution is known and unchanging. However, in today’s rapidly evolving market, solutions are rarely known upfront and change quickly.
- Critique of Functional Silos: They limit agility and make it difficult to adapt quickly. Projects are broken into tasks and assigned across functions, which slows down learning.
- Advocacy for Cross-Functional Teams: These teams are designed for speed and agility, possessing all the core abilities to ship and learn rapidly. Small, dedicated, cross-functional teams can “outperform large, siloed project teams” when testing new business ideas.
Thinking Like a Venture Capitalist
The chapter criticizes the outdated “big bang, annual funding style” common in many organizations, which incentivizes bad behavior (e.g., spending budget to avoid cuts).
- Critique of Annual Funding: It severely limits agility and reduces “at-bats” (opportunities to test). Instead of one big home run swing, organizations are better off taking “several base hit level swings.”
- Learning from Venture Capital: Venture Capital (VC) firms have a longer time horizon (8-12 years) and invest in many startups (20-30), taking a hands-off approach. Innovation funding within corporations, while often shorter (1-3 years, 5-10 internal startups) and more hands-on, should adopt similar principles of incremental investment.
Innovation Portfolio
Organizations are encouraged to adopt a venture capitalist-style approach to funding, which involves incrementally investing in a series of business ideas and doubling down on successful ones. This significantly increases “at-bats” and the chance of finding a “unicorn.”
The chapter introduces an Innovation Portfolio framework, visualizing projects across stages:
- Seed Stage: Characterized by high uncertainty, low funding (less than $50,000), small team size (1-3), and low time commitment per team member (0-10%). Objectives focus on customer understanding, context, and willingness to pay (Desirability). KPIs are about market size, customer evidence, and problem/solution fit.
- Launch Stage: Medium uncertainty, increased funding (
50,000−50,000-50,000−500,000), larger team (2-5), and higher time commitment (10-40%). Objectives expand to proven interest and indications of profitability (Viability) and feasibility (Feasibility). KPIs include opportunity size, value proposition evidence, financial evidence, and feasibility evidence. - Growth Stage: Low uncertainty, significant funding ($500,000+), larger team (5+), and high time commitment (40-50%). Objectives are about proven model at limited scale, aiming for product/market fit and business model fit. KPIs include acquisition and retention evidence.
This tiered funding model enables leaders to invest incrementally and make informed decisions at each stage, rather than committing large sums upfront.
Investment Committees
A small investment committee consisting of leadership is crucial for a venture capitalist-style funding method. These leaders need decision-making authority over the budget to guide teams through seed, launch, and growth stages. Decisions typically occur during Monthly Stakeholder Reviews (every 3-6 months for investment decisions).
Guidelines for Designing the Committee:
- 3-5 members: Keep it small for quick decisions.
- External member: Consider an Entrepreneur in Residence (EIR) for fresh perspectives.
- Decision-making authority: Members must have authority over budget and approvals.
- Entrepreneurial: Members should be willing to challenge the status quo; too many conservative members can stunt innovation.
Creating a Working Agreement: The committee should establish clear rules before engaging teams, such as:
- Be on time: Prioritize stakeholder review ceremonies.
- Make decisions in the meeting: Teams need immediate clarity on next steps.
- Leave ego at the door: Be open to being swayed by evidence from the teams, not just personal opinions.
Fostering an Environment: The committee is responsible for fostering the supportive team environment (dedicated, funded, autonomous, with support, access, and direction) discussed earlier in the book, ensuring teams can sustain over time.
Key Takeaways
“Testing Business Ideas” fundamentally teaches that reducing risk and uncertainty is the paramount task for any innovator or entrepreneur. It champions a systematic, iterative approach to validate assumptions before committing significant resources, transforming vague ideas into viable businesses through continuous learning and adaptation. The book provides a practical roadmap, moving from designing the right team and shaping ideas to executing and learning from diverse experiments.
The core lessons from the book are:
- Prioritize testing over premature execution: Never build without strong evidence that your idea is desirable, feasible, and viable.
- Break down ideas into testable hypotheses: Understand and address the three key risks: desirability (do they want it?), feasibility (can we build it?), and viability (should we build it?).
- Embrace rapid, iterative experimentation: Start cheap and fast, increasing the fidelity and strength of evidence as uncertainty decreases.
- Cultivate an experimentation mindset and culture: Leaders must foster an environment of continuous learning, psychological safety (it’s okay to be wrong), and evidence-based decision-making.
- Systematize the testing process: Implement ceremonies and flow principles to ensure consistent progress and collaboration across teams.
Next actions to take immediately:
- Identify your riskiest assumptions: Use the Assumptions Mapping framework to pinpoint the “make or break” hypotheses for your idea.
- Design your first low-fidelity experiment: Choose a cheap and fast discovery experiment from the library to test your most critical desirability hypothesis. Don’t overthink; just start.
- Establish a weekly learning ritual: Commit to regularly debriefing with your team to analyze evidence, generate insights, and decide on clear next steps, rather than getting stuck in analysis paralysis.
- Challenge your own biases: Actively seek evidence that might disprove your beliefs, not just confirm them.
Reflection prompts:
- What is the single biggest assumption I am making about my current business idea that, if proven false, would cause it to fail?
- Am I willing to invest in small, rapid experiments to test this assumption, even if it means confronting uncomfortable truths about my idea?
- How can I, or my organization, better support a culture where failure in experimentation is seen as a valuable learning opportunity, rather than a reason for blame?






Leave a Reply